Terminology
| Aggregate | Combines data to show an average across selected periods. |
| Class | Category of data, such as Food or Beverage. |
| Forecast | Predicted sales for a future period. |
| Comparison Period | A selected timeframe used for benchmarking. |
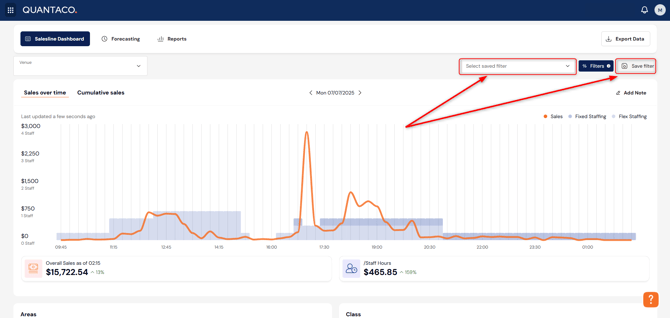
Accessing Filters
-
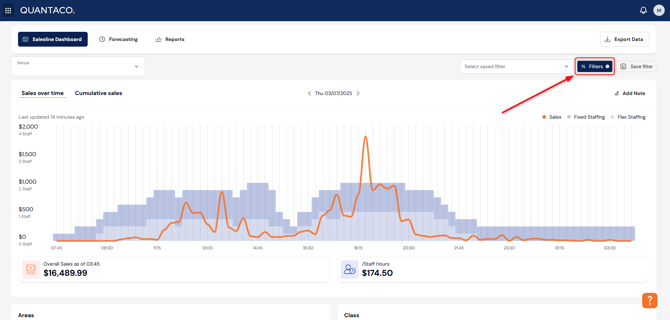
Click the Filters button in the top-right corner of your screen.
-
The Filter menu will open, allowing you to customise your view.
Dates
-
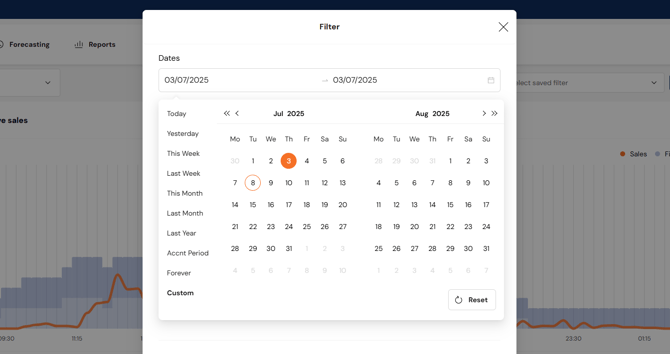
Click in the Date box to select a start and end date.
-
Use the options on the left for quick selections like Last 7 Days or This Month.
Comparison
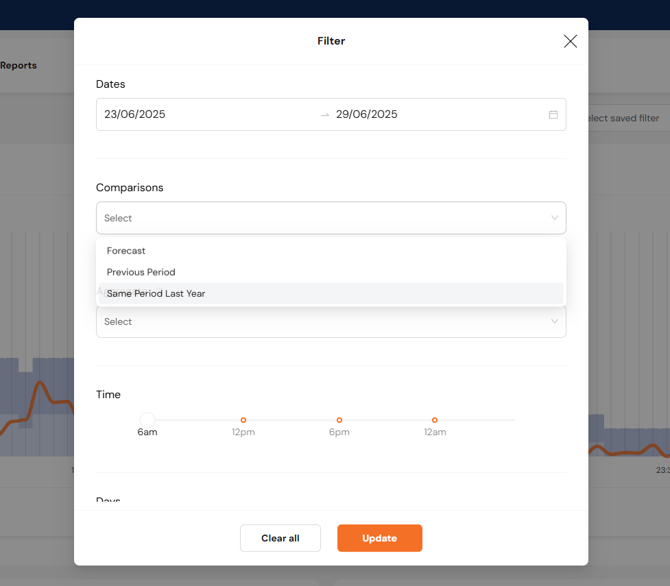
Use this section to compare the selected date range with another period:
-
Forecast – Compare against the forecasted performance (see Forecasting article).
-
Previous Period – Compares the period immediately before the selected one.
-
Same Day Last Week – Compares to the same day(s) last week.
-
Same Period Last Year – Compares with the same date range from the prior year.
Aggregate
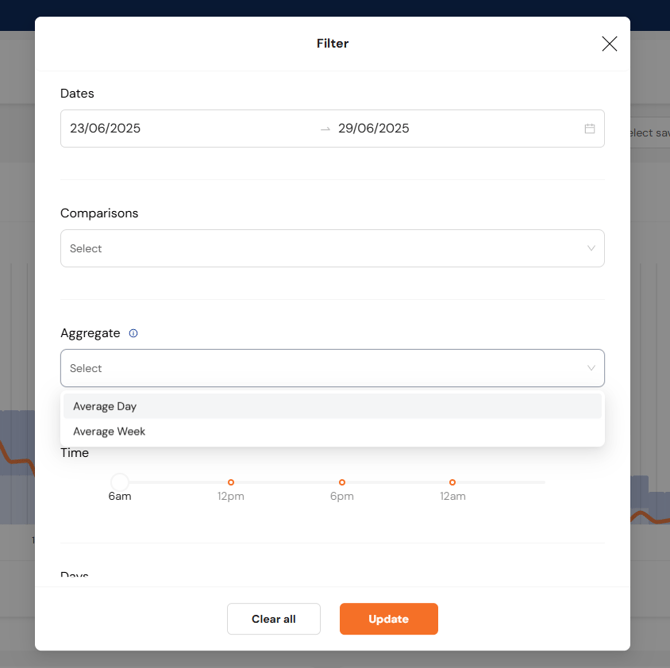
Combine data across multiple days or weeks for an average view:
-
Day – Averages all selected days into a single day view.
-
Week – Averages selected weeks into a single week view.
Use this to spot recurring efficiency patterns over time.
Time
-
Select specific time ranges (e.g. 11am–3pm) to focus on peak trading periods.

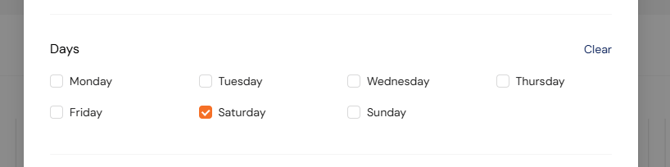
Days
-
Highlight specific days within the selected date range.
-
Can be used alongside Aggregate to analyse trends by weekday.
For example, a month time period can be selected then use the days filter to select only Saturdays.
This can be used in combination with the aggregate filters to look at the average figures on specific days.
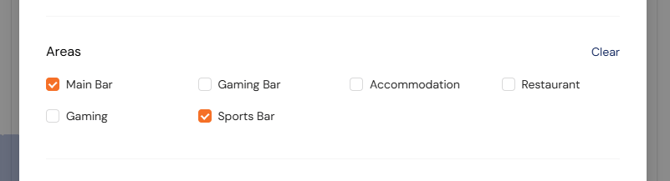
Areas
-
Filter by specific venue areas (e.g. bar, kitchen) if your venue has multiple sections.
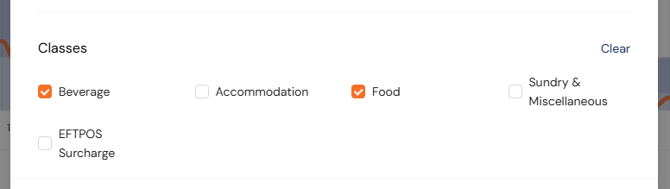
Classes
-
Filter by class (e.g. Food, Beverage) to review wage efficiency by category.
Saving Filters
-
After setting your filters, click Save Filter in the top-right corner.
-
Saved filters appear in the Saved Filters dropdown for quick access.
FAQs
Q: Can I save and reuse my custom filters?
A: Yes. Use the Save Filter option to store and quickly reapply your setup.
Q: What’s the difference between Day and Week aggregation?
A: Day averages all selected days into one, while Week averages them by week.
Q: How can I compare current data to forecasted values?
A: Select Forecast under the Comparison section. See the Forecasting article for more details.