The Salesline Dashboard helps monitor sales performance and staffing efficiency in real time. It’s divided into three main sections: Sales Dashboard, Charts & Employment Spread.
Terminology
| /Staff Hours | Total sales divided by total staff hours - a measure of efficiency. |
| Fixed Staff | Full-time or Part-time staff scheduled |
| Flex Staff | Casual staff scheduled |
| Comparison Period | A timeframe used as a benchmark to compare performance. |
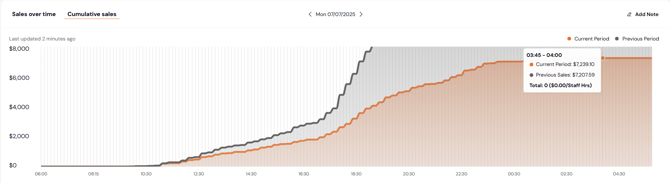
Sales Over Time

-
View sales (orange line) and staff hours (blue bars) in 15-minute intervals.
-
Hover over any time block to see a breakdown of sales and staffing for that period.
-
/Staff Hours shows sales per staff hour — a key efficiency metric.
-
The total sales figure represents sales for the highlighted period.
Sales & staff hours in this view is powered by Quantaco's mapping. See the Integration Mapping Article for more details

Cumulative Sales
-
Shows a rolling total of sales throughout the day.
-
Compare current period performance against a selected historical period.
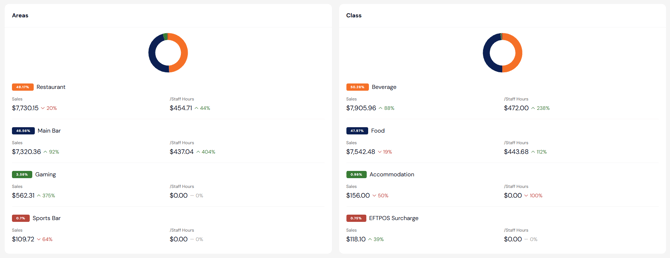
Charts
-
View breakdowns of Sales and /Staff Hours by:
-
Area (e.g. bar, kitchen)
-
Class (e.g. food, beverage categories)
-
-
Use this to identify areas of strong or poor staffing efficiency across Area or Class.
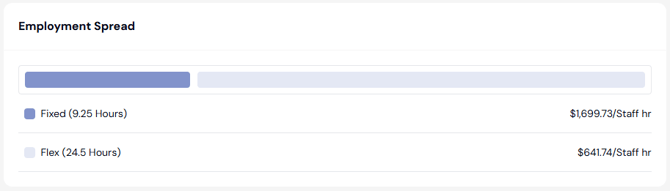
Employment Spread
-
Shows total hours worked by:
-
Fixed Staff (permanent team members)
-
Flex Staff (casual based team members)
-
-
Displays /Staff Hours separately for each group.
-
Also visible on the Sales Over Time chart in 15-minute increments.
FAQs
Q: Where does the data in the Sales Dashboard come from?
A: It is sourced from your POS and time & attendance systems and mapped through QCloud. See the Integration Mapping article for details.
Q: Can I filter by area, class, or time period?
A: Yes. Use the Filter section to refine your view. Refer to the Filters article for guidance.
Q: What is considered a good /Staff Hours rate?
A: This varies by venue type, but generally, higher values indicate better efficiency. Use the efficiency report to benchmark performance over time.