
Note: The UI/UX Uplift is currently available for selected regions and is not yet offered to Melbourne clients For information on when the UI/UX Uplift will be available in your region, please contact your account manager.
Overview
The Shift Summary UI/UX Uplift is a redesigned version of the Shift Summary screen, delivering a cleaner interface, streamlined financial data, mobile optimisation, and enhanced shift report question formatting.
What's New?Enhanced UI and UX
The Shift Summary screen has undergone a complete user interface and user experience overhaul. The new design makes it easier to navigate, review information, and access key insights quickly without demanding scrolling.
Key Financial Data at a Glance
We've simplified the the summary layout to focus on the most important financial metrics. Critical shift performance data is now presented in a clear, easy-to-read format, allowing managers to quickly assess results without navigating through complex visualisations.
Removal of Complex Charts
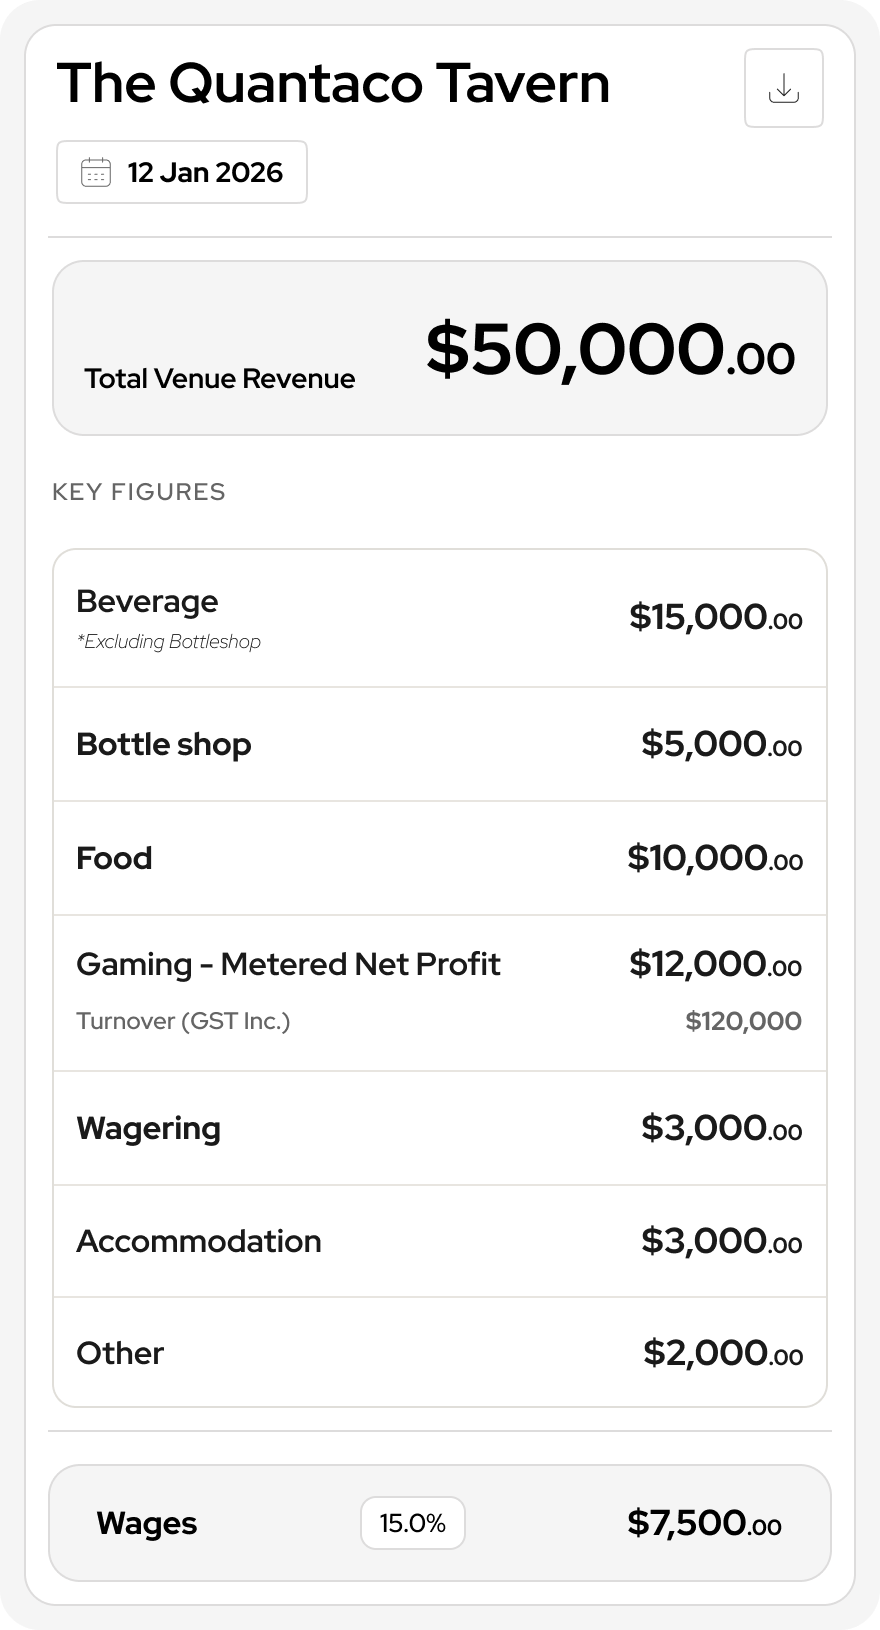
Difficult-to-read charts and graphs have been removed in favour of streamlined data presentation. This ensures that important information is easier to interpret and act upon.
Optimised for Smart Devices
The new Shift Summary has been designed with mobile and tablet users in mind. Whether you're on the restaurant floor, travelling between locations, or reviewing performance remotely, the experience is now faster and more responsive across smart devices.
Improved Shift Report Questions
Shift Summary questions now support rich text editing and enhanced layout formatting. This allows managers to provide more detailed responses while making answers significantly easier to read and review.
The rich text editor supports:
- Bold formatting
- Line breaks
- Bulleted lists
The rich text editor does not support:
- URLs/links
- Images & File attachments
New Key Figure: Bottle Shop
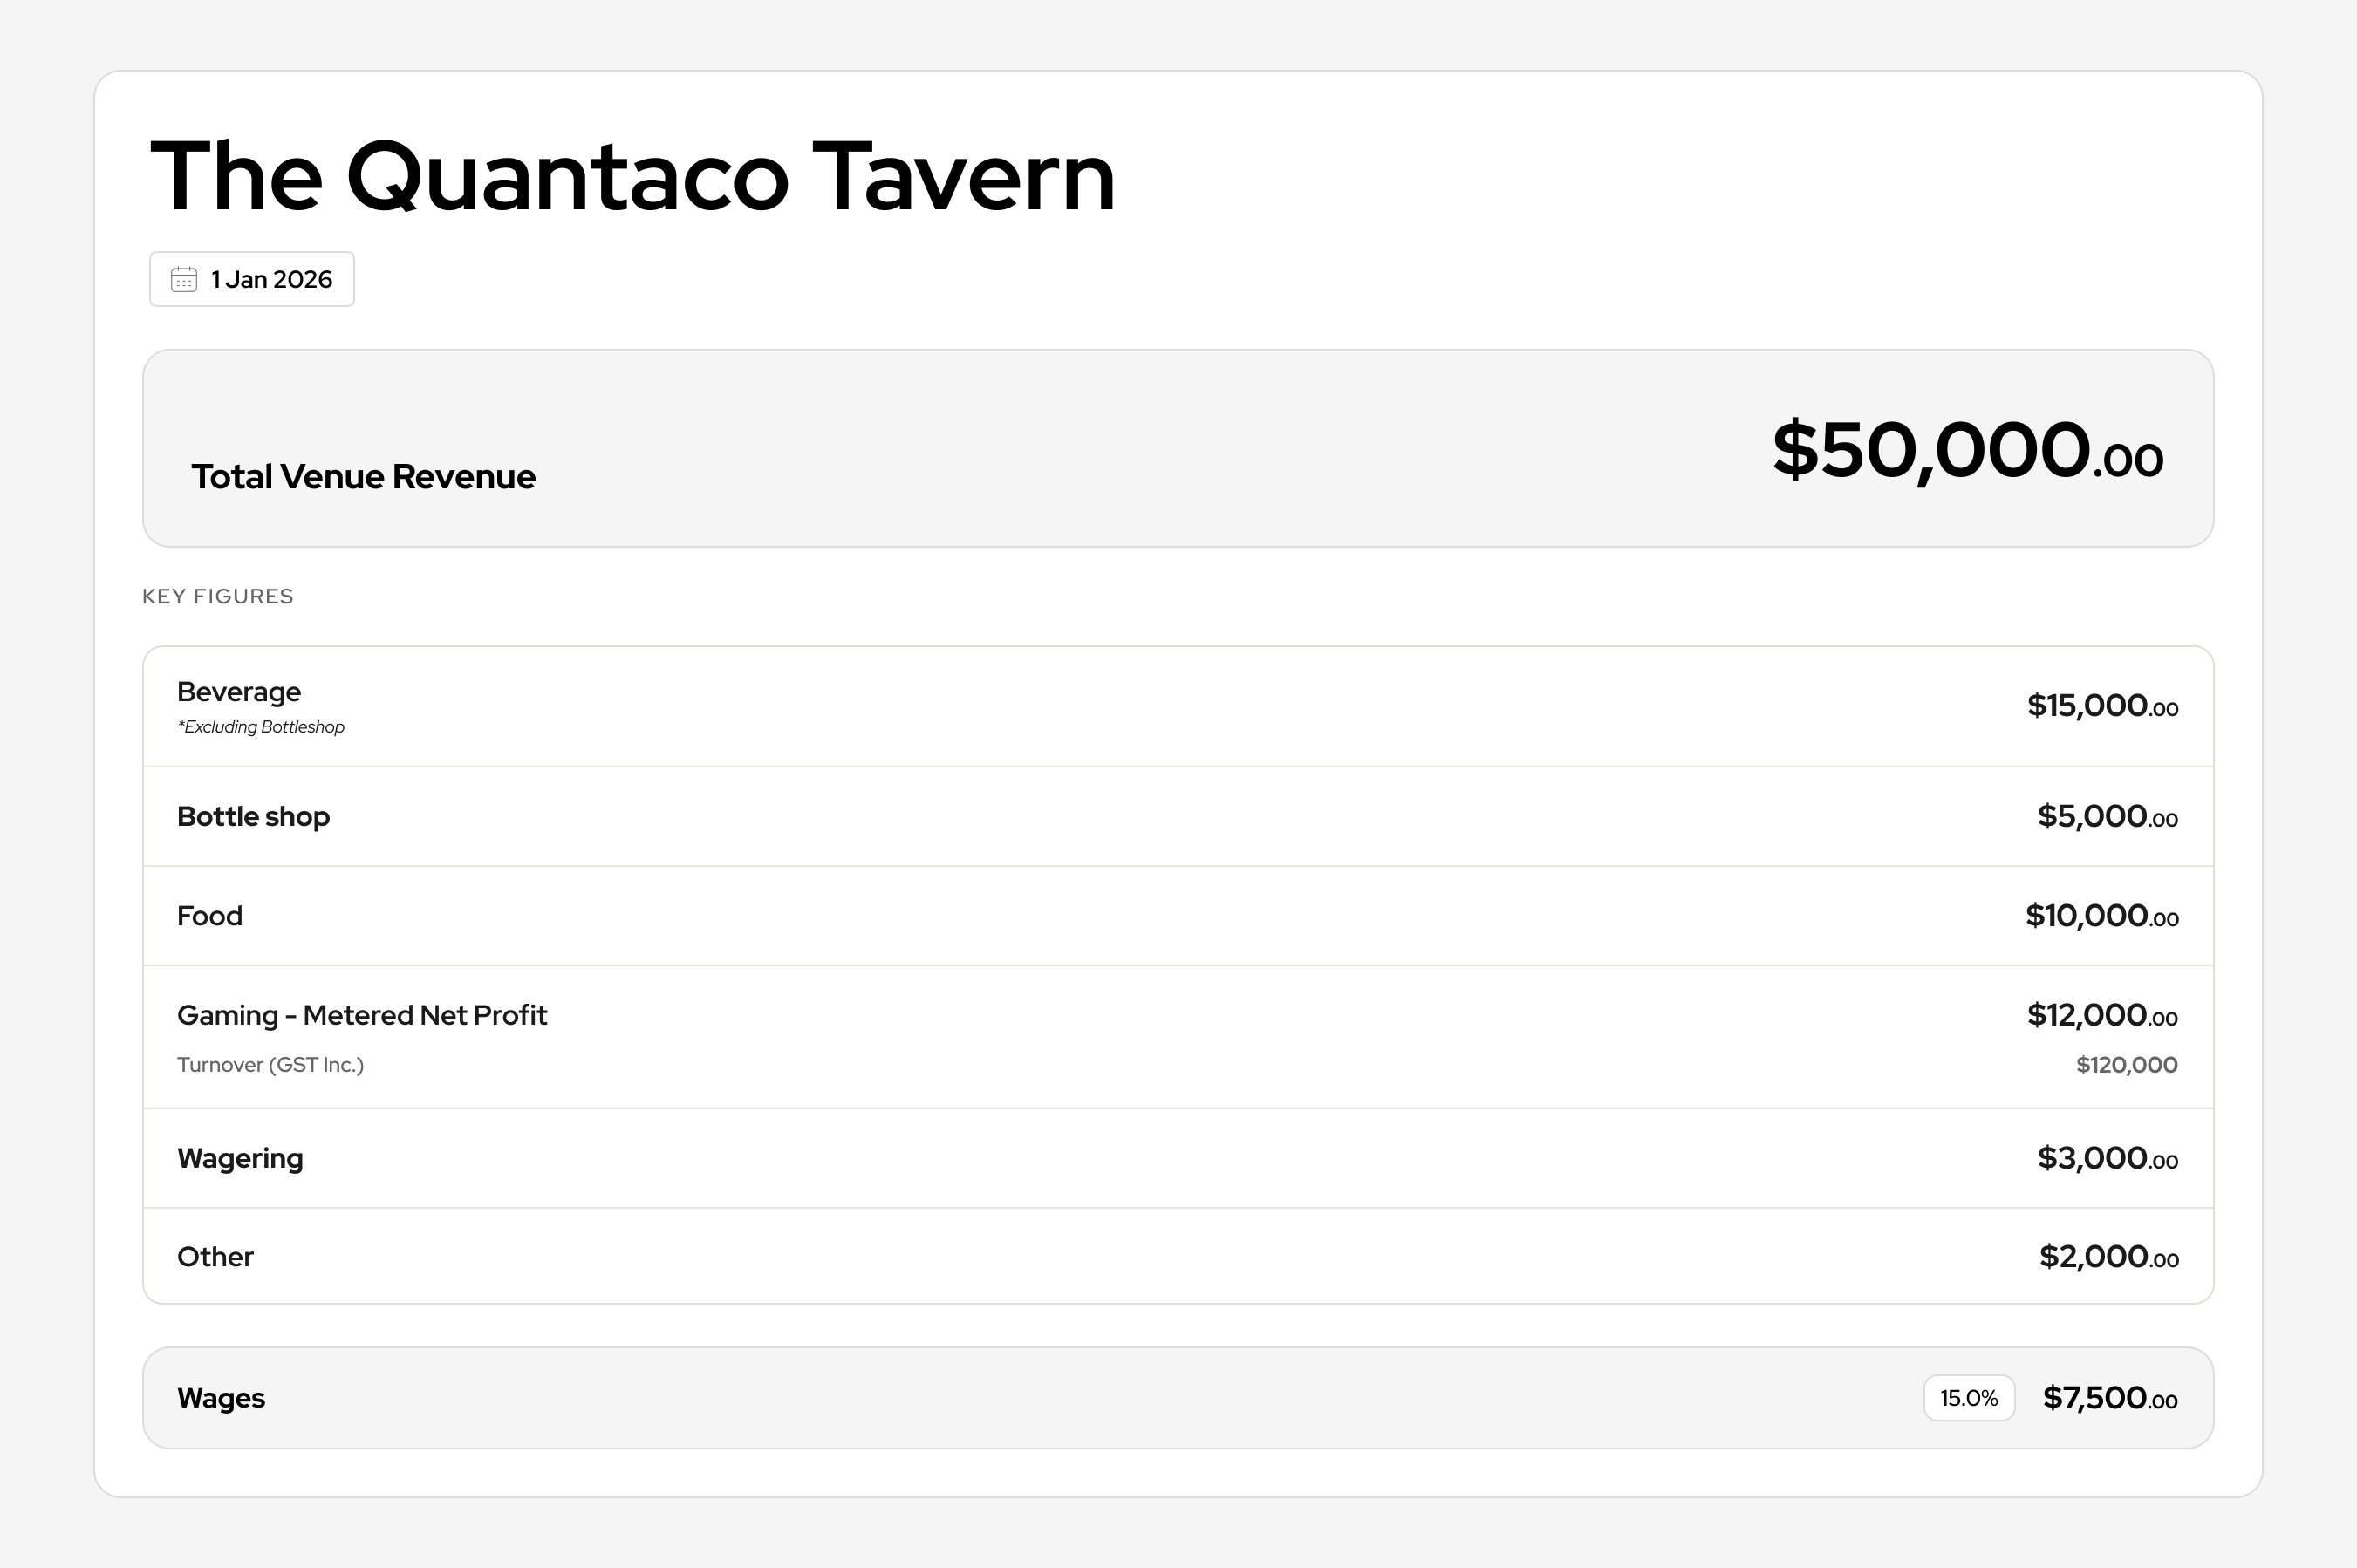
If you have a Bottle Shop area configured as a distinct POS area in your venue, you'll be able to see its total revenue on the top line of your Shift Summary. We've also added a table showing the total broken down by area.
This means Beverage in particular will read lower for any venue with a bottle shop area, since that volume has moved out into its own line and section.
Note: The Bottle Shop Key Figure displays as a single combined total per area, not broken down by sales class.
Key Figures
The table below summarises each key figure shown on the top line of the Shift Summary screen:
| Key Figure | What it shows |
|
Total Venue Revenue |
Total Revenue across POS, Gaming actual Net Metered, Wagering Commissions |
|
Beverage |
Beverage class sales |
|
Food |
Food class sales |
|
Other |
Other class sales |
|
Accommodation |
Accommodation class revenue |
|
Net Gaming |
Metered NET Profit |
|
Actual Turnover |
Total gaming turnover, GST inclusive |
|
Wagering |
Keno and TAB commission combined |
|
Wages |
Total wage cost, shown in dollars and as a percentage of Total Venue Revenue |
If your venue has a Bottle Shop area configured, Beverage, Food and Other will exclude that area's sales, and a separate Bottle Shop figure will appear — see New Key Figure: Bottle Shop above.
Benefits
- Faster access to key operational and financial information
- Improved readability across all report sections
- Better mobile and tablet experience
- More professional and structured shift reporting
- Easier review of detailed manager comments and responses
The redesigned Shift Summary helps managers spend less time navigating reports and more time making informed operational decisions. If you have questions about the new layout or Key Figures, contact your account manager or refer to related help articles.